Ethereum Price Struggles to Rebound—Key Hurdles In The Way


Ethereum price started a fresh decline below the $1,650 zone. ETH is now consolidating and might decline further below the $1,550 support zone.
- Ethereum started a fresh decline below the $1,650 and $1,620 levels.
- The price is trading below $1,600 and the 100-hourly Simple Moving Average.
- There is a new connecting bearish trend line forming with resistance at $1,600 on the hourly chart of ETH/USD (data feed via Kraken).
- The pair could start a fresh increase if it clears the $1,655 resistance zone.
Ethereum Price Faces Resistance
Ethereum price struggled to continue higher above $1,700 and started a fresh decline, like Bitcoin . ETH declined below the $1,620 and $1,600 support levels. It even spiked below $1,550.
A low was formed at $1,538 and the price is now correcting some losses . There was a move above the $1,565 level. The price climbed above the 23.6% Fib retracement level of the downward move from the $1,690 swing high to the $1,538 low.
Ethereum price is now trading below $1,600 and the 100-hourly Simple Moving Average. On the upside, the price seems to be facing hurdles near the $1,600 level. There is also a new connecting bearish trend line forming with resistance at $1,600 on the hourly chart of ETH/USD.
The next key resistance is near the $1,615 level or the 50% Fib retracement level of the downward move from the $1,690 swing high to the $1,538 low. The first major resistance is near the $1,650 level. A clear move above the $1,650 resistance might send the price toward the $1,690 resistance.
An upside break above the $1,690 resistance might call for more gains in the coming sessions. In the stated case, Ether could rise toward the $1,750 resistance zone or even $1,800 in the near term.
Another Decline In ETH?
If Ethereum fails to clear the $1,600 resistance, it could start another decline. Initial support on the downside is near the $1,560 level. The first major support sits near the $1,535 zone.
A clear move below the $1,535 support might push the price toward the $1,500 support. Any more losses might send the price toward the $1,420 support level in the near term. The next key support sits at $1,400.
Technical Indicators
Hourly MACD – The MACD for ETH/USD is losing momentum in the bearish zone.
Hourly RSI – The RSI for ETH/USD is now above the 50 zone.
Major Support Level – $1,535
Major Resistance Level – $1,650
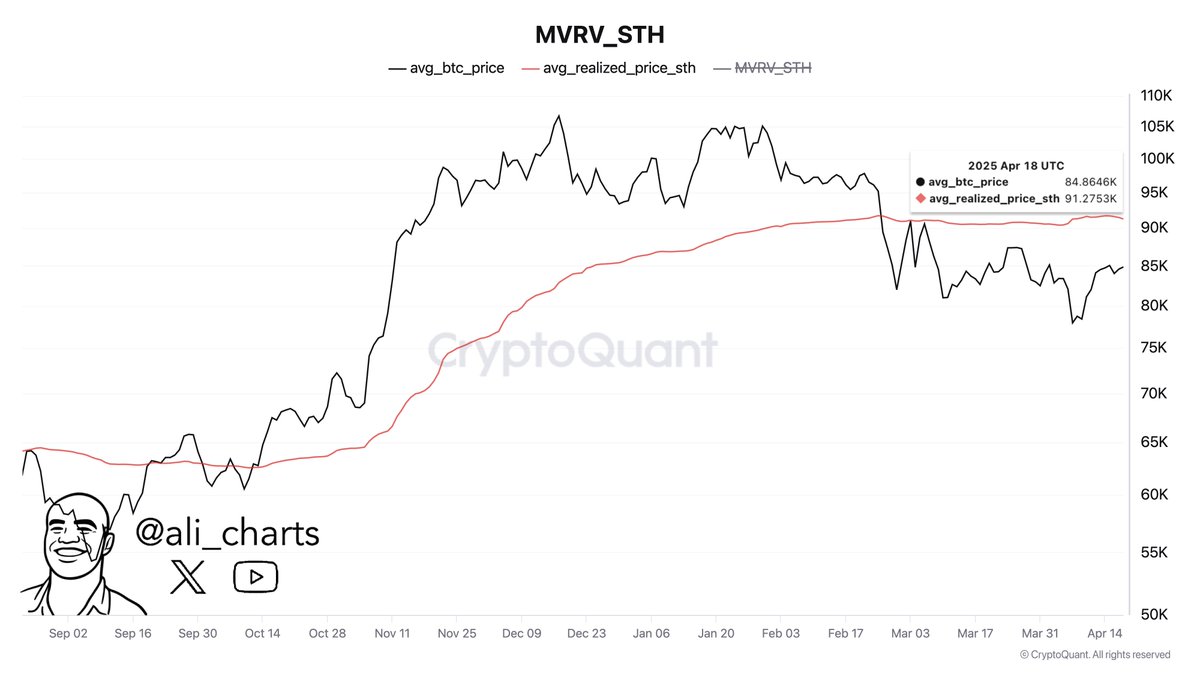
Bitcoin Faces Critical Resistance At $91,000 As Short-Term Holders Hover At Break-Even
Bitcoin prices gained by only 0.95% in the past week amidst an intense market consolidation. The pre...
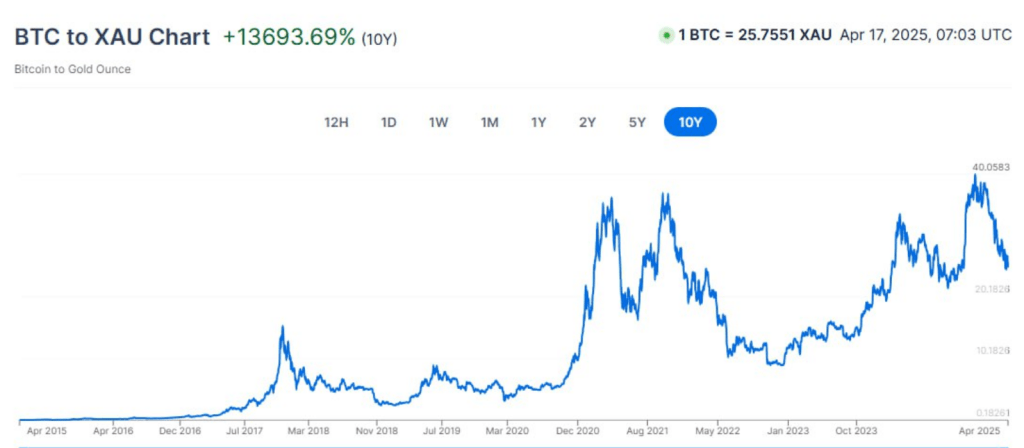
Bitcoin Outshines Gold By Over 13,000% — ‘Let The Numbers Speak’, Expert Says
Bitcoin has risen dramatically over the last 10 years against gold, with a rise of an incredible 13,...
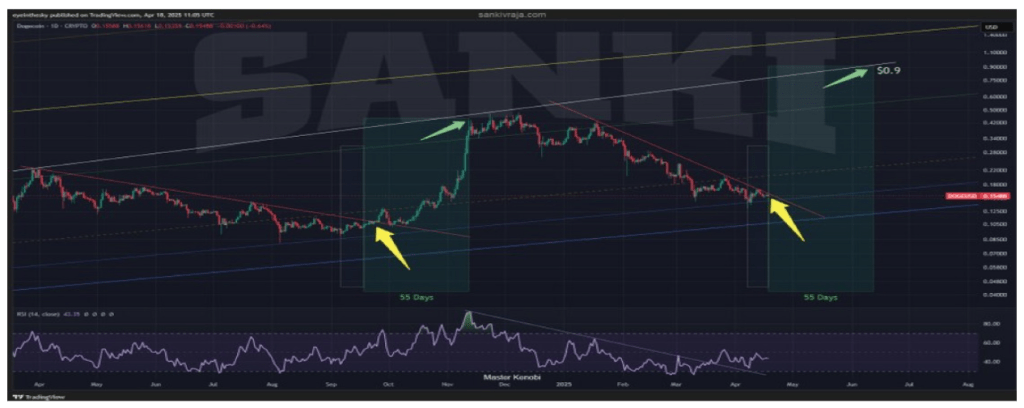
Dogecoin Price Closes In On Major Trendline For Breakout To $1
The Dogecoin price is closing in on a critical technical trendline that could ignite its next major ...