XRP Price Momentum Spikes — $2.25 Break Could Spark Bigger Rally


XRP price started a fresh increase above the $2.150 zone. The price is now consolidating above $2.20 and might clear the $2.250 resistance.
- XRP price started a fresh increase above the $2.120 zone.
- The price is now trading above $2.150 and the 100-hourly Simple Moving Average.
- There is a connecting bullish trend line forming with support at $2.20 on the hourly chart of the XRP/USD pair (data source from Kraken).
- The pair might gain bullish momentum if it clears the $2.250 resistance zone.
XRP Price Gains Strength
XRP price started a recovery wave above the $2.0650 and $2.10 resistance levels, like Bitcoin and Ethereum . The price traded above the $2.120 and $2.150 levels to start a decent increase.
The bulls even pushed the price toward $2.250 before the bears appeared. A high was formed at $2.2490 and the price started a downside correction. There was a move below the $2.2350 and $2.2220 support levels. The price even tested the 23.6% Fib retracement level of the upward move from the $2.060 swing low to the $2.2490 high.
However, the bulls protected the $2.20 support. The price is now trading above $2.220 and the 100-hourly Simple Moving Average. There is also a connecting bullish trend line forming with support at $2.20 on the hourly chart of the XRP/USD pair.
On the upside, the price might face resistance near the $2.2450 level. The first major resistance is near the $2.250 level. The next resistance is $2.350. A clear move above the $2.350 resistance might send the price toward the $2.50 resistance. Any more gains might send the price toward the $2.620 resistance or even $2.650 in the near term. The next major hurdle for the bulls might be $2.80.
Another Decline?
If XRP fails to clear the $2.250 resistance zone, it could start another decline. Initial support on the downside is near the $2.20 level and the trend line. The next major support is near the $2.150 level and the 50% Fib retracement level of the upward move from the $2.060 swing low to the $2.2490 high.
If there is a downside break and a close below the $2.150 level, the price might continue to decline toward the $2.120 support. The next major support sits near the $2.080 zone.
Technical Indicators
Hourly MACD – The MACD for XRP/USD is now gaining pace in the bullish zone.
Hourly RSI (Relative Strength Index) – The RSI for XRP/USD is now above the 50 level.
Major Support Levels – $2.20 and $2.150.
Major Resistance Levels – $2.250 and $2.350.
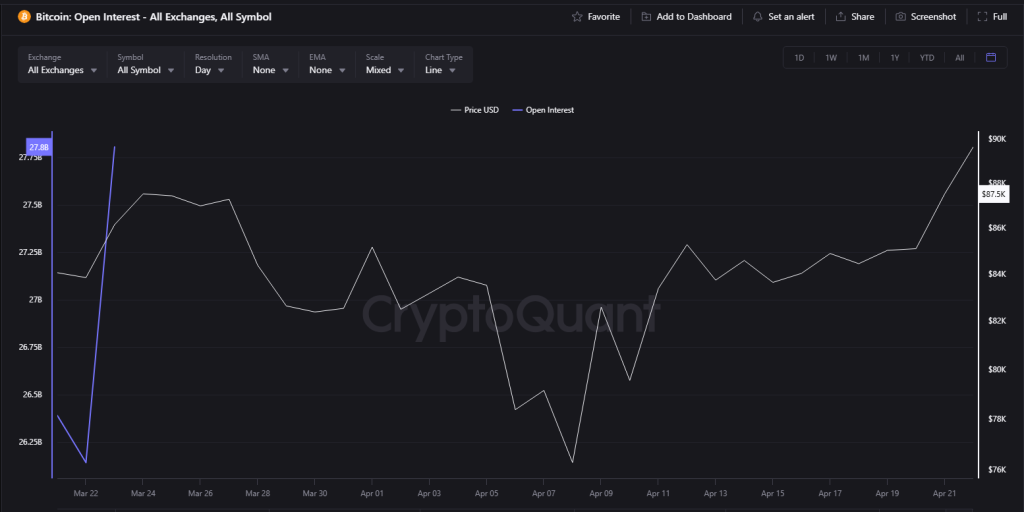
Bitcoin Rockets To Monthly Highs As Open Interest Explodes By Over $3 Billion
Bitcoin rose to $89,292 today, its highest since April 2, as traders injected funds into cryptocurre...
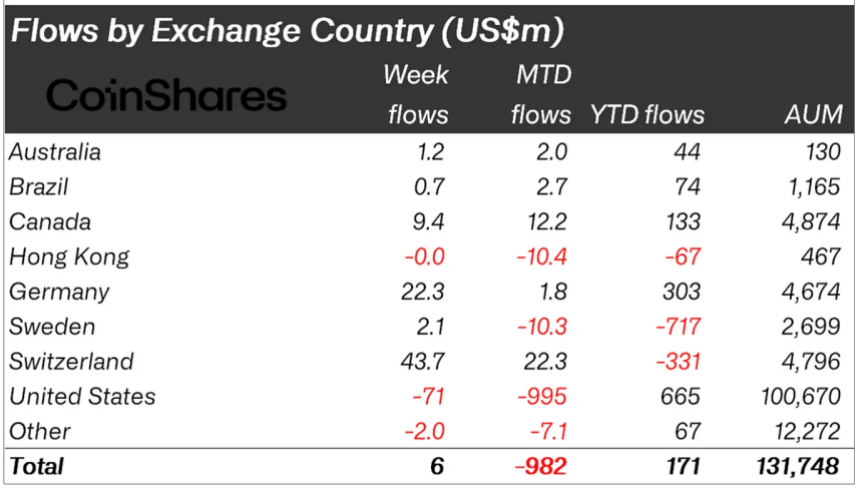
XRP Gains Ground in Weekly Crypto Inflows as Ethereum Continues Downtrend
According to CoinShares’ latest weekly report, crypto investment products registered slight net infl...
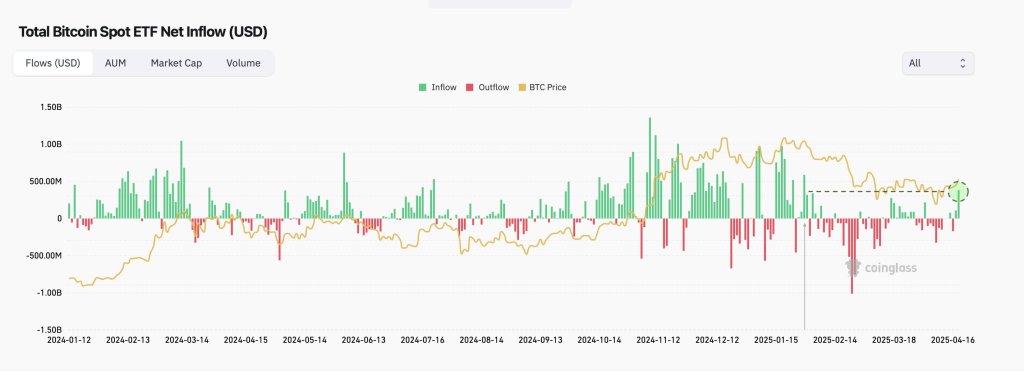
Bitcoin Shoots Above $90,000—Will $92,000 Fall Next?
Bitcoin spent Tuesday flirting with territory last seen in early March this year, printing an intrad...