Bitcoin Breaks Out: Chart Pattern Targets $96,200 To $102,100 As Next Big Test Zone


Bitcoin has broken out of a technical formation that may place it on track toward a decisive test zone between $96,200 and $102,100. If confirmed in the coming days, the movement would represent a major price development in Bitcoin’s ongoing market structure . A crypto analyst highlighted this zone as one where Bitcoin’s trajectory could either extend to new highs or face its next rejection.
Descending Broadening Wedge Breakout Clears Path To $100,000 Again
Bitcoin’s price action in the past 24 hours is highlighted by a return to $85,000 as buying pressure started to creep in. Interestingly, this buying pressure has broken out above the upper trendline of a descending broadening wedge formation. This pattern is typically considered a reversal signal, and its breakout implies strong upward continuation if validated.
The breakout of the formation was noted in an analysis posted on social media platform X by crypto analyst Titan of Crypto. Notably, the price chart shared by the analyst shows that the wedge formation has been taking place in the daily candlestick timeframe over the past three months. The wedge began forming after Bitcoin’s peak above $108,000 in late January and gradually widened.
At the time of the analysis, Bitcoin’s price had already made two daily candlestick closes above the upper trendline of the broadening wedge. According to the analyst, the breakout will most likely be confirmed this week. If confirmed, this will open up the stage for a run above the $100,000 price level again or at least $96,200.
Particularly, Titan of Crypto highlighted the region between $96,200 and $102,100 as the next target zone. The analyst emphasized that this range may act as the actual test of Bitcoin’s strength, as it will reveal whether the breakout leads to continuation or stalls into rejection.
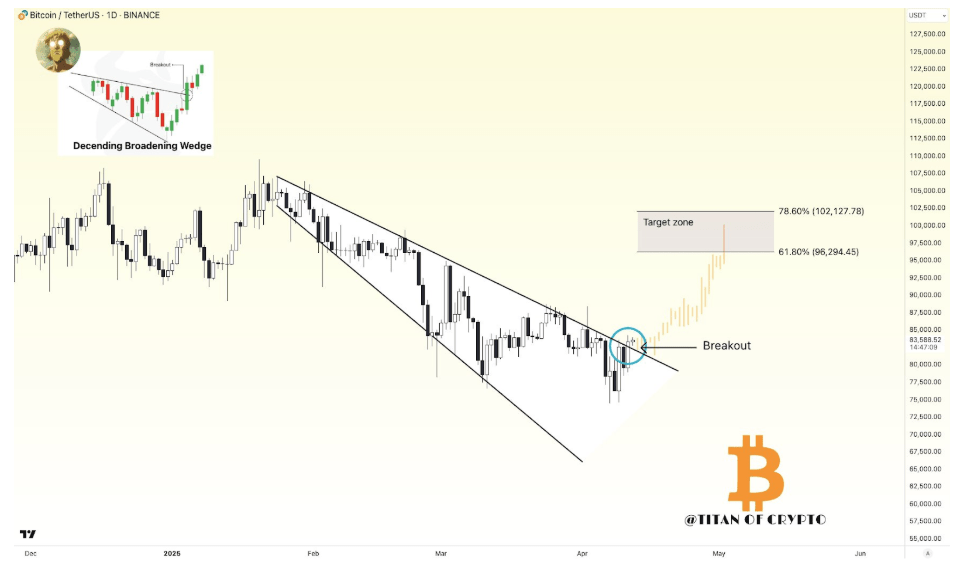
Image From X: Titan of Crypto
Leverage Build-Up Points To $8 Billion Short Squeeze Potential Above $90,000
Crypto analyst Sensei also commented on Bitcoin’s current price structure, noting that a move to $90,000 could trigger a massive liquidation event. Based on data from Coinglass, more than $8 billion in short positions would be vulnerable if Bitcoin rose above $90,000 again.

The cumulative short liquidation chart from Coinglass shows a large wall of leveraged short interest concentrated below that level across major exchanges like Binance, OKX, and Bybit.
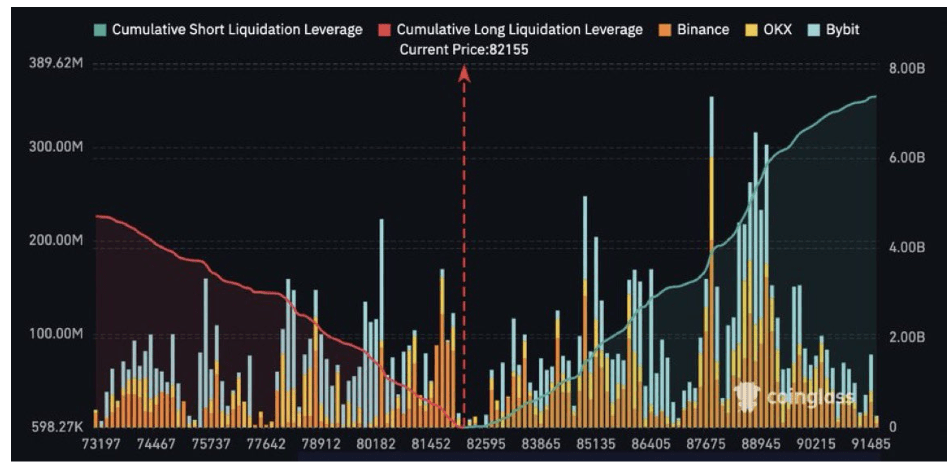
Image From X: Sensei
The data reflects a significant imbalance in the derivatives market, with short positions dominating until the $90,000 mark, beyond which liquidation-driven buying could intensify. If Bitcoin does push into this zone, the resulting cascade of liquidations among short positions may provide the momentum required to push the Bitcoin price toward the $96,200 to $102,100 target zone.
At the time of writing, Bitcoin was trading at $84,706.
Featured image from Freepik, chart from TradingView

Strategy’s Bitcoin Portfolio Grows To Nearly 600,000 BTC After Recent Purchase
Michael Saylor’s Bitcoin (BTC) proxy firm, Strategy, has made headlines once again by purchasing an ...
Behind The Mantra (OM) Collapse: Glassnode Reveals The On-Chain Side Of Things
Mantra has just gone through a crash that has wiped out most of its value. Here’s how on-chain metri...
On-Chain Clues Suggest Bitcoin Bounce Might Be a False Signal—Here’s What to Know
Bitcoin has shown signs of stabilization following its earlier correction this month, which saw the ...