Pi Coin Price Forecast for April 3: Can PI Hold Above $0.55 After 16.79% Daily Drop?


- Pi Coin drops 16.79% in 24 hours, nearing its all-time low amid market-wide losses.
- Trading volume spikes 104%, but price pressure continues due to token release plans.
- RSI and MACD indicators reflect weak momentum, signaling ongoing bearish sentiment.
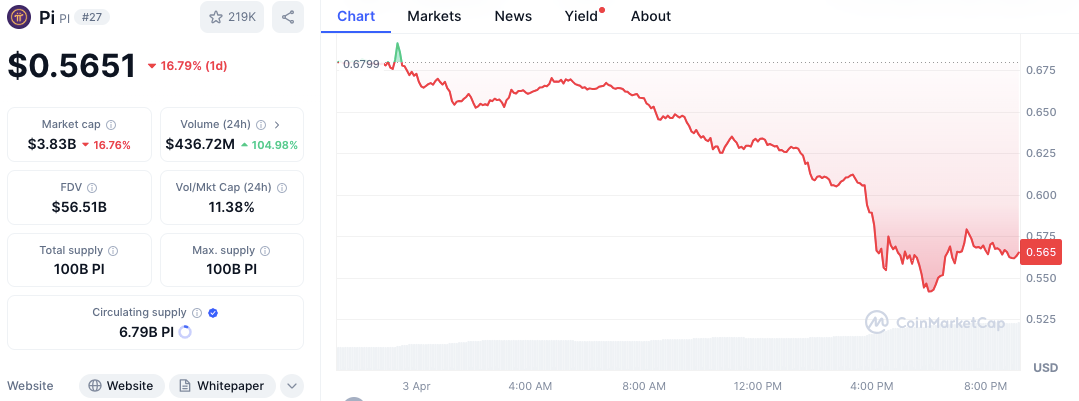
The crypto market continued its downward trend on April 3, with Pi Coin (PI) among the hardest hit. The token saw a price drop of 16.79% in a single day, falling to $0.5651.
This decline was part of a broader trend, as Pi Coin has now registered a 61.08% decrease in value over the past month and an 18.01% fall over the last seven days. The latest price action places Pi Coin close to its all-time low, showing ongoing weakness across the board.
Trading Volume Surges Despite Price Drop
However, Pi Coin value continues to experience a downtrend while the trading volume has improved. The 24-hour trading volume also surged by more than 104% to $436,720,033. This increase in activity can be attributed to more investor actions, arguably attributed to factors in the global economy and general stock market trends. The coin’s market capitalization has also decreased and is now at a value of approximately 3.83 billion.

Pi Coin’s circulating supply is currently 6.79 billion PI tokens, part of a larger total and maximum supply of 100 billion tokens. Based on current figures, the fully diluted valuation (FDV) stands at $56.51 billion. This metric projects the possible market capitalization if all tokens were in circulation.
External Pressures and Token Unlocking Impact Price
Several external elements are contributing to Pi Coin’s ongoing losses. Macroeconomic conditions, including rising U.S. inflation and concerns over tariffs, have added pressure to the general digital asset market. These conditions have created a bearish environment where most cryptocurrencies, including Pi Coin, are trading in the red.
In addition to market-wide influences, the Pi network faces internal developments that may affect investor sentiment. A planned token release remains a key factor. An additional 1.5 billion PI tokens are scheduled to enter circulation this year. The anticipation of increased supply contributes to ongoing sell pressure, limiting any chance of sustained recovery.
Technical Indicators Signal Ongoing Weakness
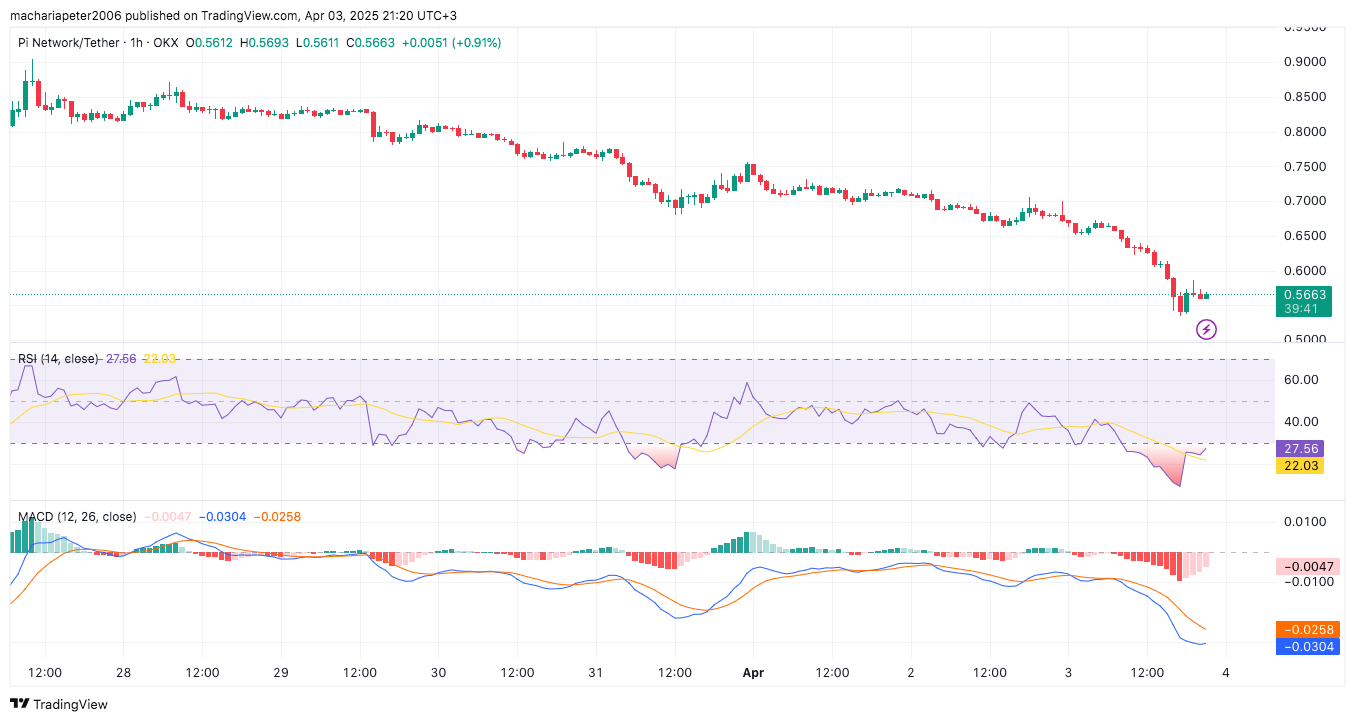
Technical analysis of Pi Coin’s one-hour chart further supports a bearish outlook. The Moving Average Convergence Divergence (MACD) shows the MACD line at -0.0304, which remains below the signal line at -0.0258. This negative alignment indicates continued downward momentum, although the histogram has shown a slight contraction.

The Relative Strength Index (RSI) currently stands at 27.56. This level is below the standard oversold threshold of 30, suggesting the asset remains under strong selling pressure. Earlier, the RSI touched a low of 22.03 before recovering slightly. Despite this minor improvement, the RSI has not moved into neutral territory, signaling limited buying interest.
Caution Persists as Price Nears Key Support
According to the latest data, Pi Coin’s price has surged by 0.91% to $0.5663. However, this movement has not altered the broader trend.
If the price breaks below the $0.55 support area, the downside will be even more likely, as volume and technical indicators show continued volatility. Despite trading pressure for Pi Coin’s shorter timeframe forecast, market players stay vigilant.

UQUID Integrates Velo as dApp #218 to Power Crypto Shopping
In this partnership, Velo Protocol will operate as a dApp in the Web3 dApp store of UQUID to boost i...

Qubetics: The Top Contender of the Next Bull Run Crypto as SEI and XRP Gear Up for 2025
Explore the best cryptos to hold in 2025, featuring Qubetics, SEI, and XRP. Learn how each coin stan...

Binance Sees Over 50% of Returning Users Deposit Again Within 16 Days, Signaling Active Trading Surge
Binance has recently revealed that more than half of their returning users deposit cryptocurrencies ...

